


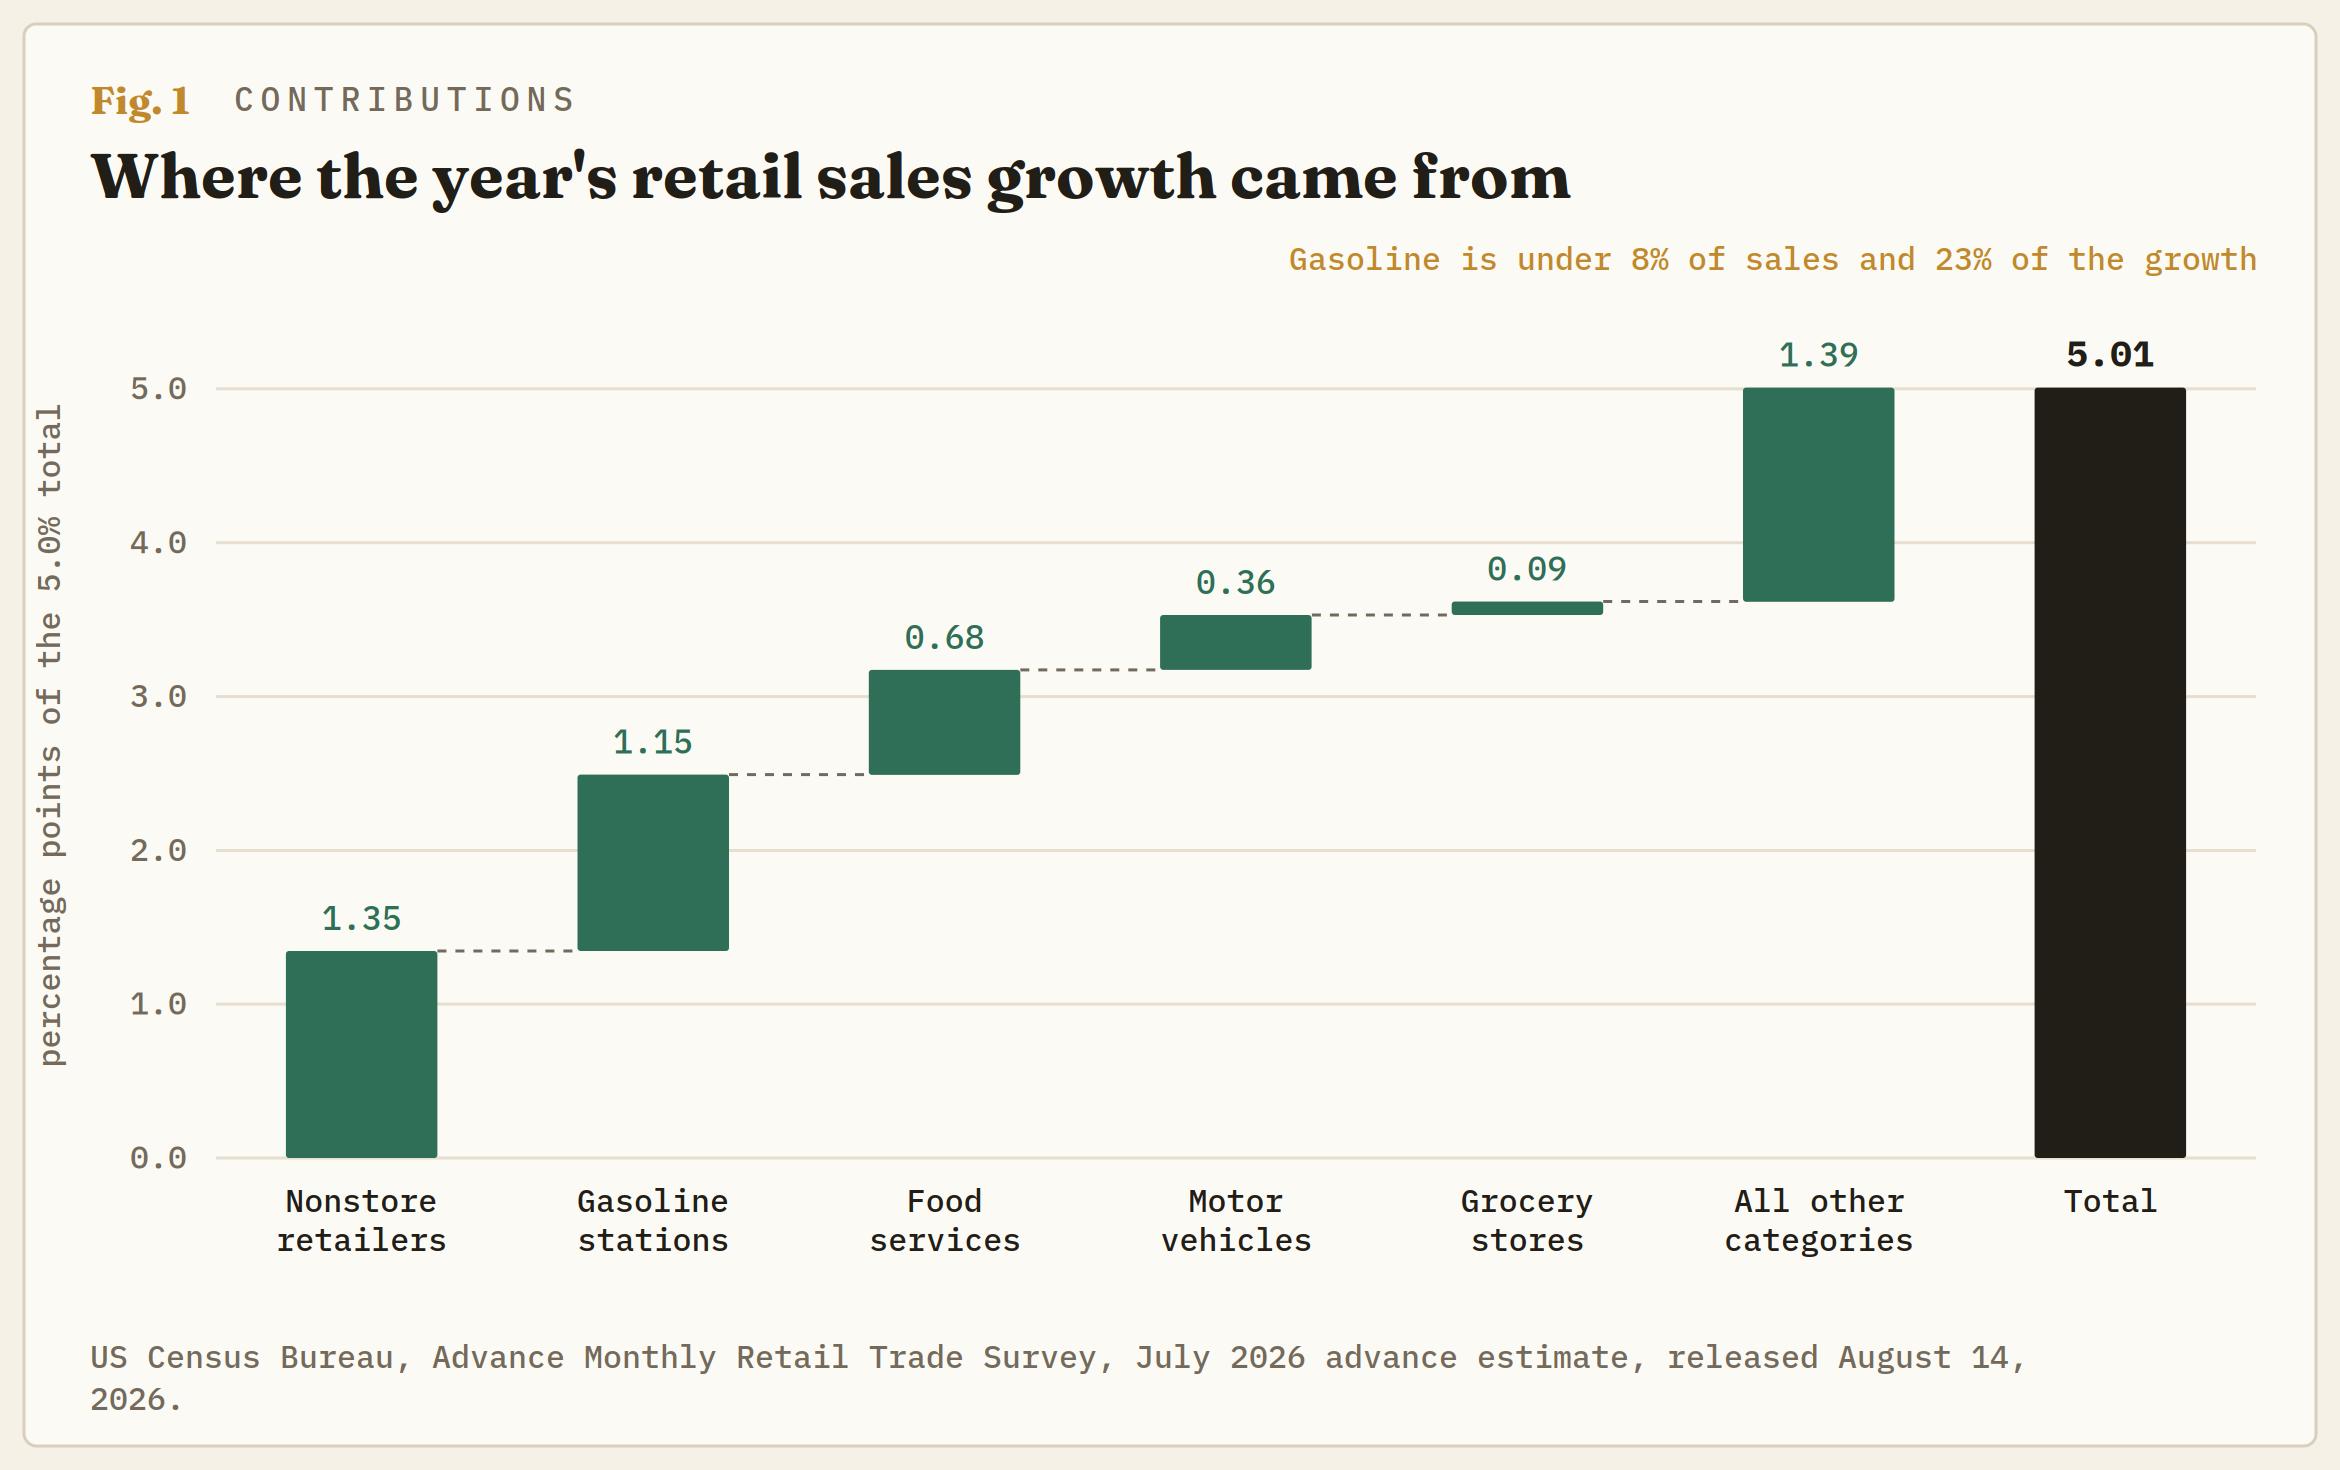
US retail and food services sales are 5% higher than a year ago, which reads like a consumer in reasonable health. Nearly a quarter of that increase came from gasoline stations, where the dollars are a war tax rather than a purchase, and those receipts have now fallen two months running. Strip the pump out and the year’s growth is 4.2% against 3.4% inflation, which is a consumer standing still.
The July advance estimate printed -0.6% on the month against a 0.2% consensus. That is the number the wires will carry today. It is close to the least interesting thing in the report.
The pump wrote a quarter of the year’s growth
Gasoline stations took $59.879 billion of July’s $763.602 billion in sales, a shade under 8% of the base. They accounted for 22.9% of the entire year-over-year increase in dollars, worth 1.15 percentage points of the 5% headline. That is a category three times more important to the growth rate than to the level.
Those receipts have been falling since May, from $64.138 billion to $60.430 billion in June to $59.879 billion in July, some $4.259 billion off the peak in two months. Crude has come down from the summer highs and the pump has followed it lower. Every dollar that leaves the forecourt subtracts directly from the retail sales headline, which means the single largest contributor to the year’s growth is now running in reverse.
That has an obvious consequence and a less obvious one. The obvious one is that the headline keeps deteriorating from here without a single household changing its behaviour. The less obvious one is that the deterioration is a relief, because falling fuel prices are the closest thing to a tax cut the US consumer has had this year, and they land hardest in the deciles where fuel is the largest line in the budget.
Seven percent less fuel, at a quarter more per gallon
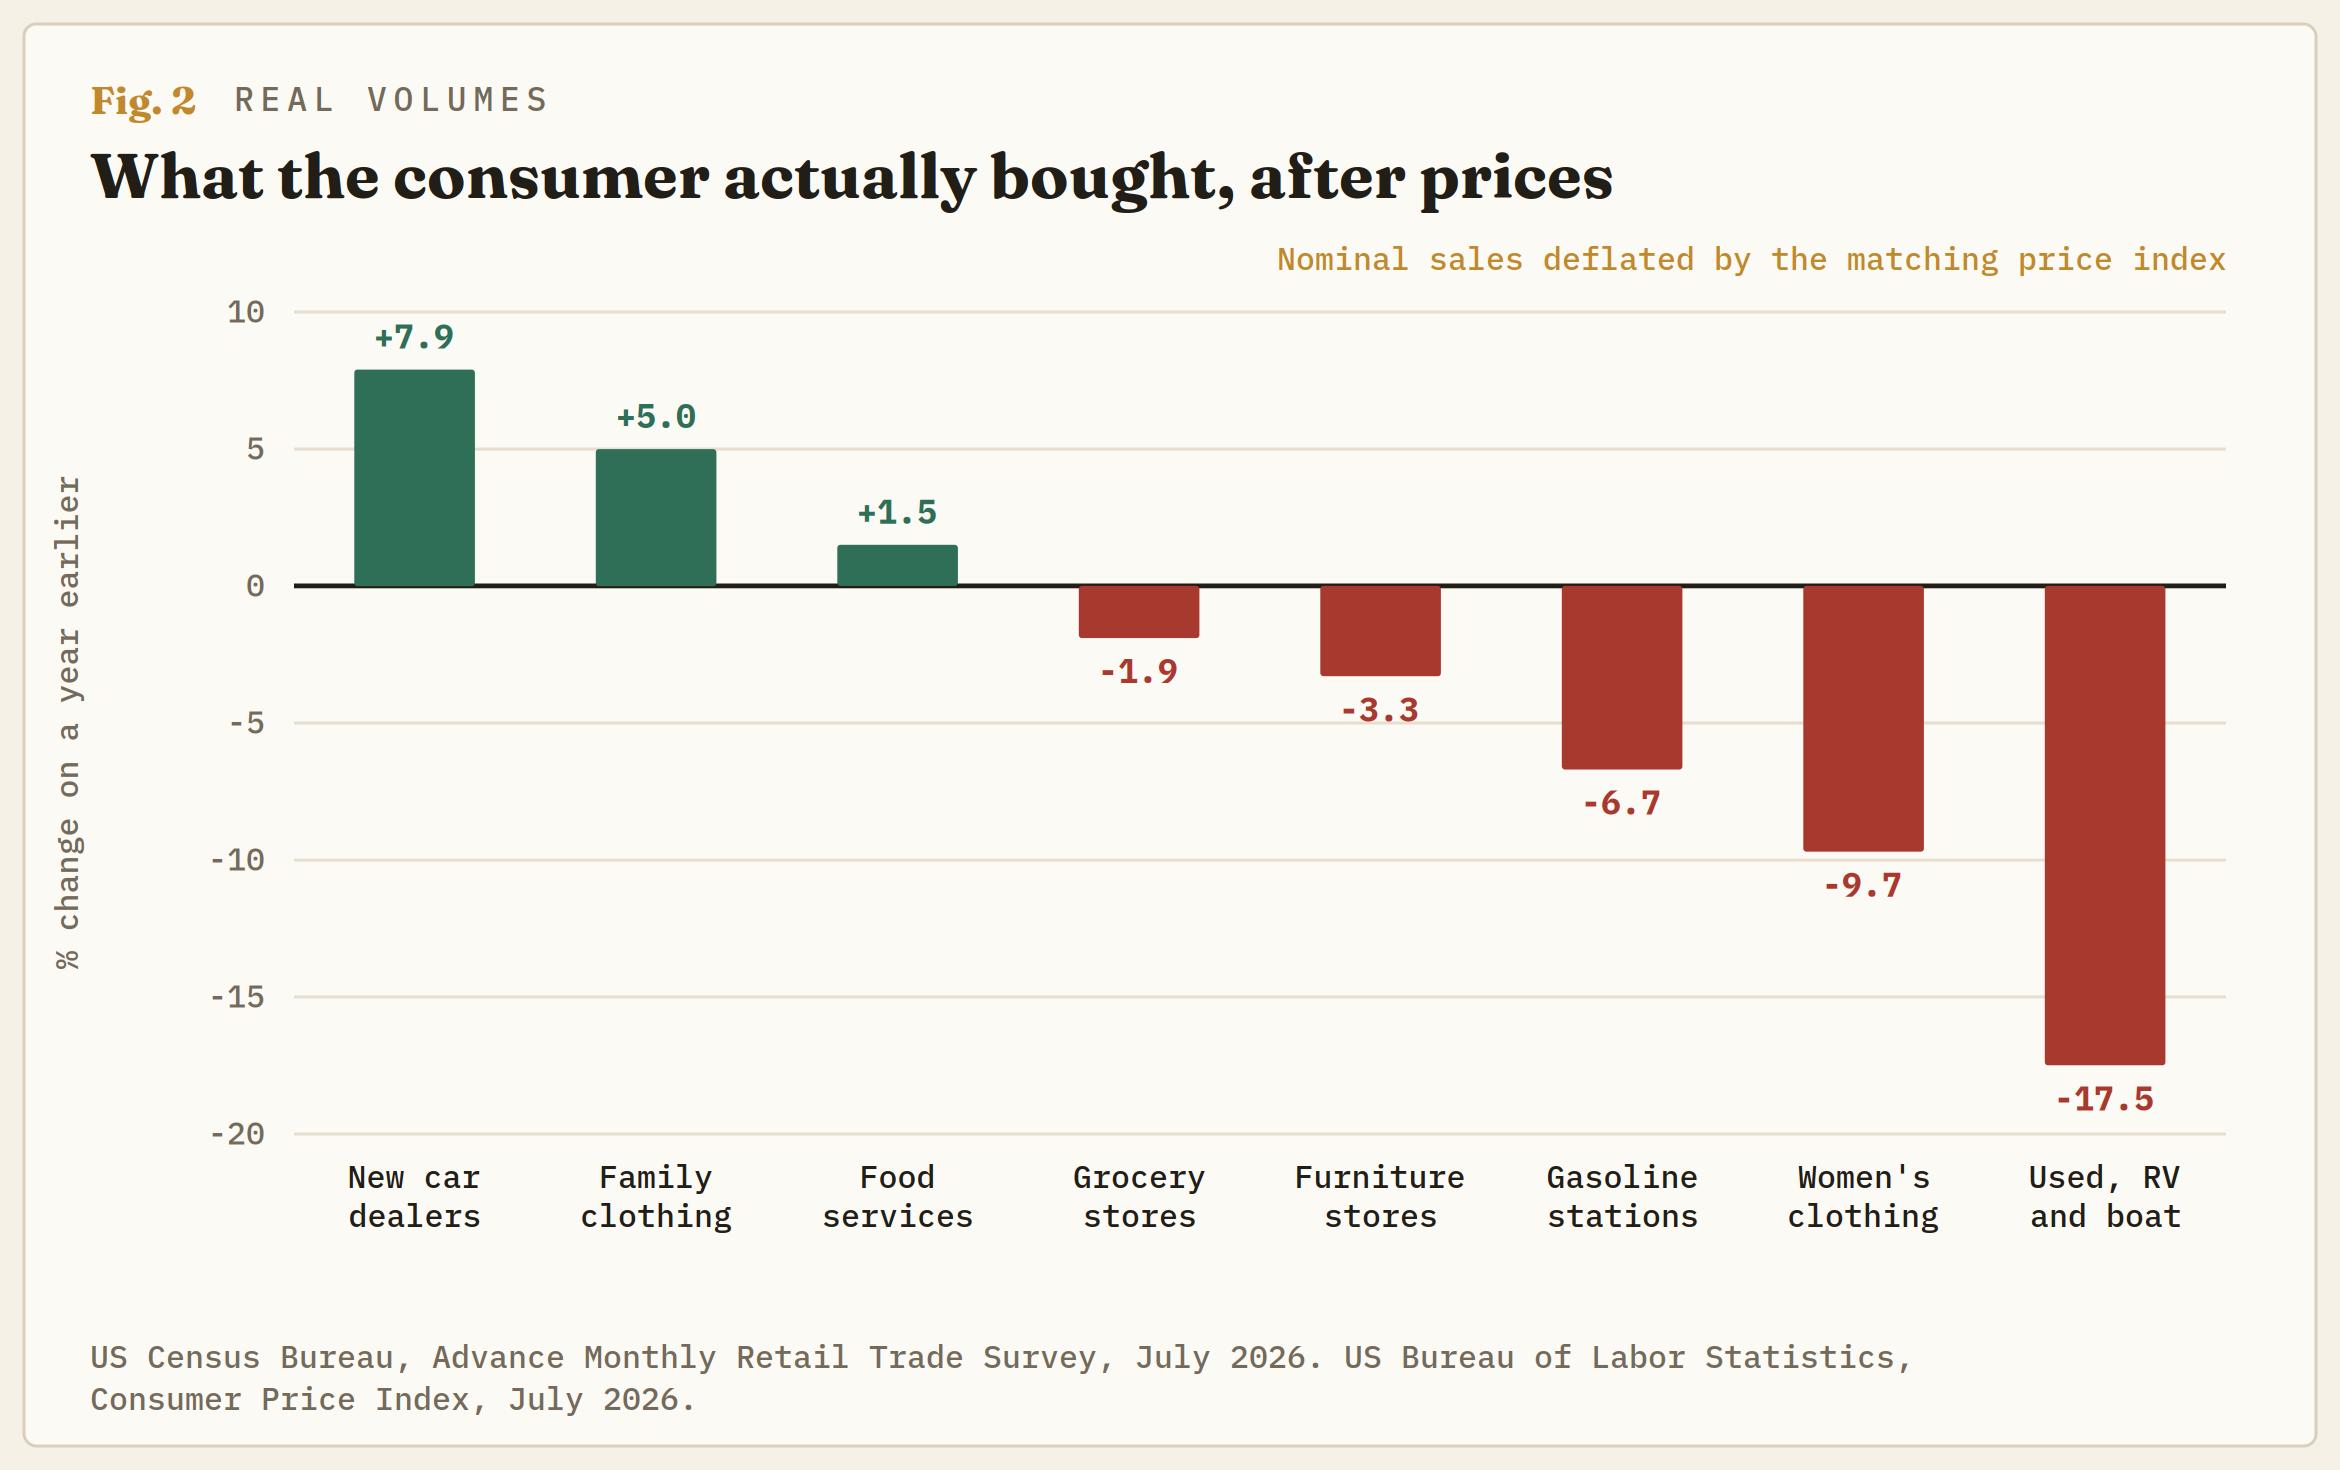
Retail sales are counted in dollars and not in gallons, which is where the report hides its best number. Gasoline prices rose 24.6% over the 12 months to July per the Consumer Price Index (CPI). Gasoline station receipts rose 16.2% over the same period. Divide one into the other and Americans bought roughly 7% less fuel than a year ago while paying 16% more for it.
That is demand destruction measured rather than inferred, and it is the cleanest reading of household stress anywhere in the release, because fuel is the most inelastic thing a commuter buys. When volumes fall 7% on a good nobody can substitute away from, the household is not economising at the margin. It is driving less.
What a household defers when it cannot defer the commute
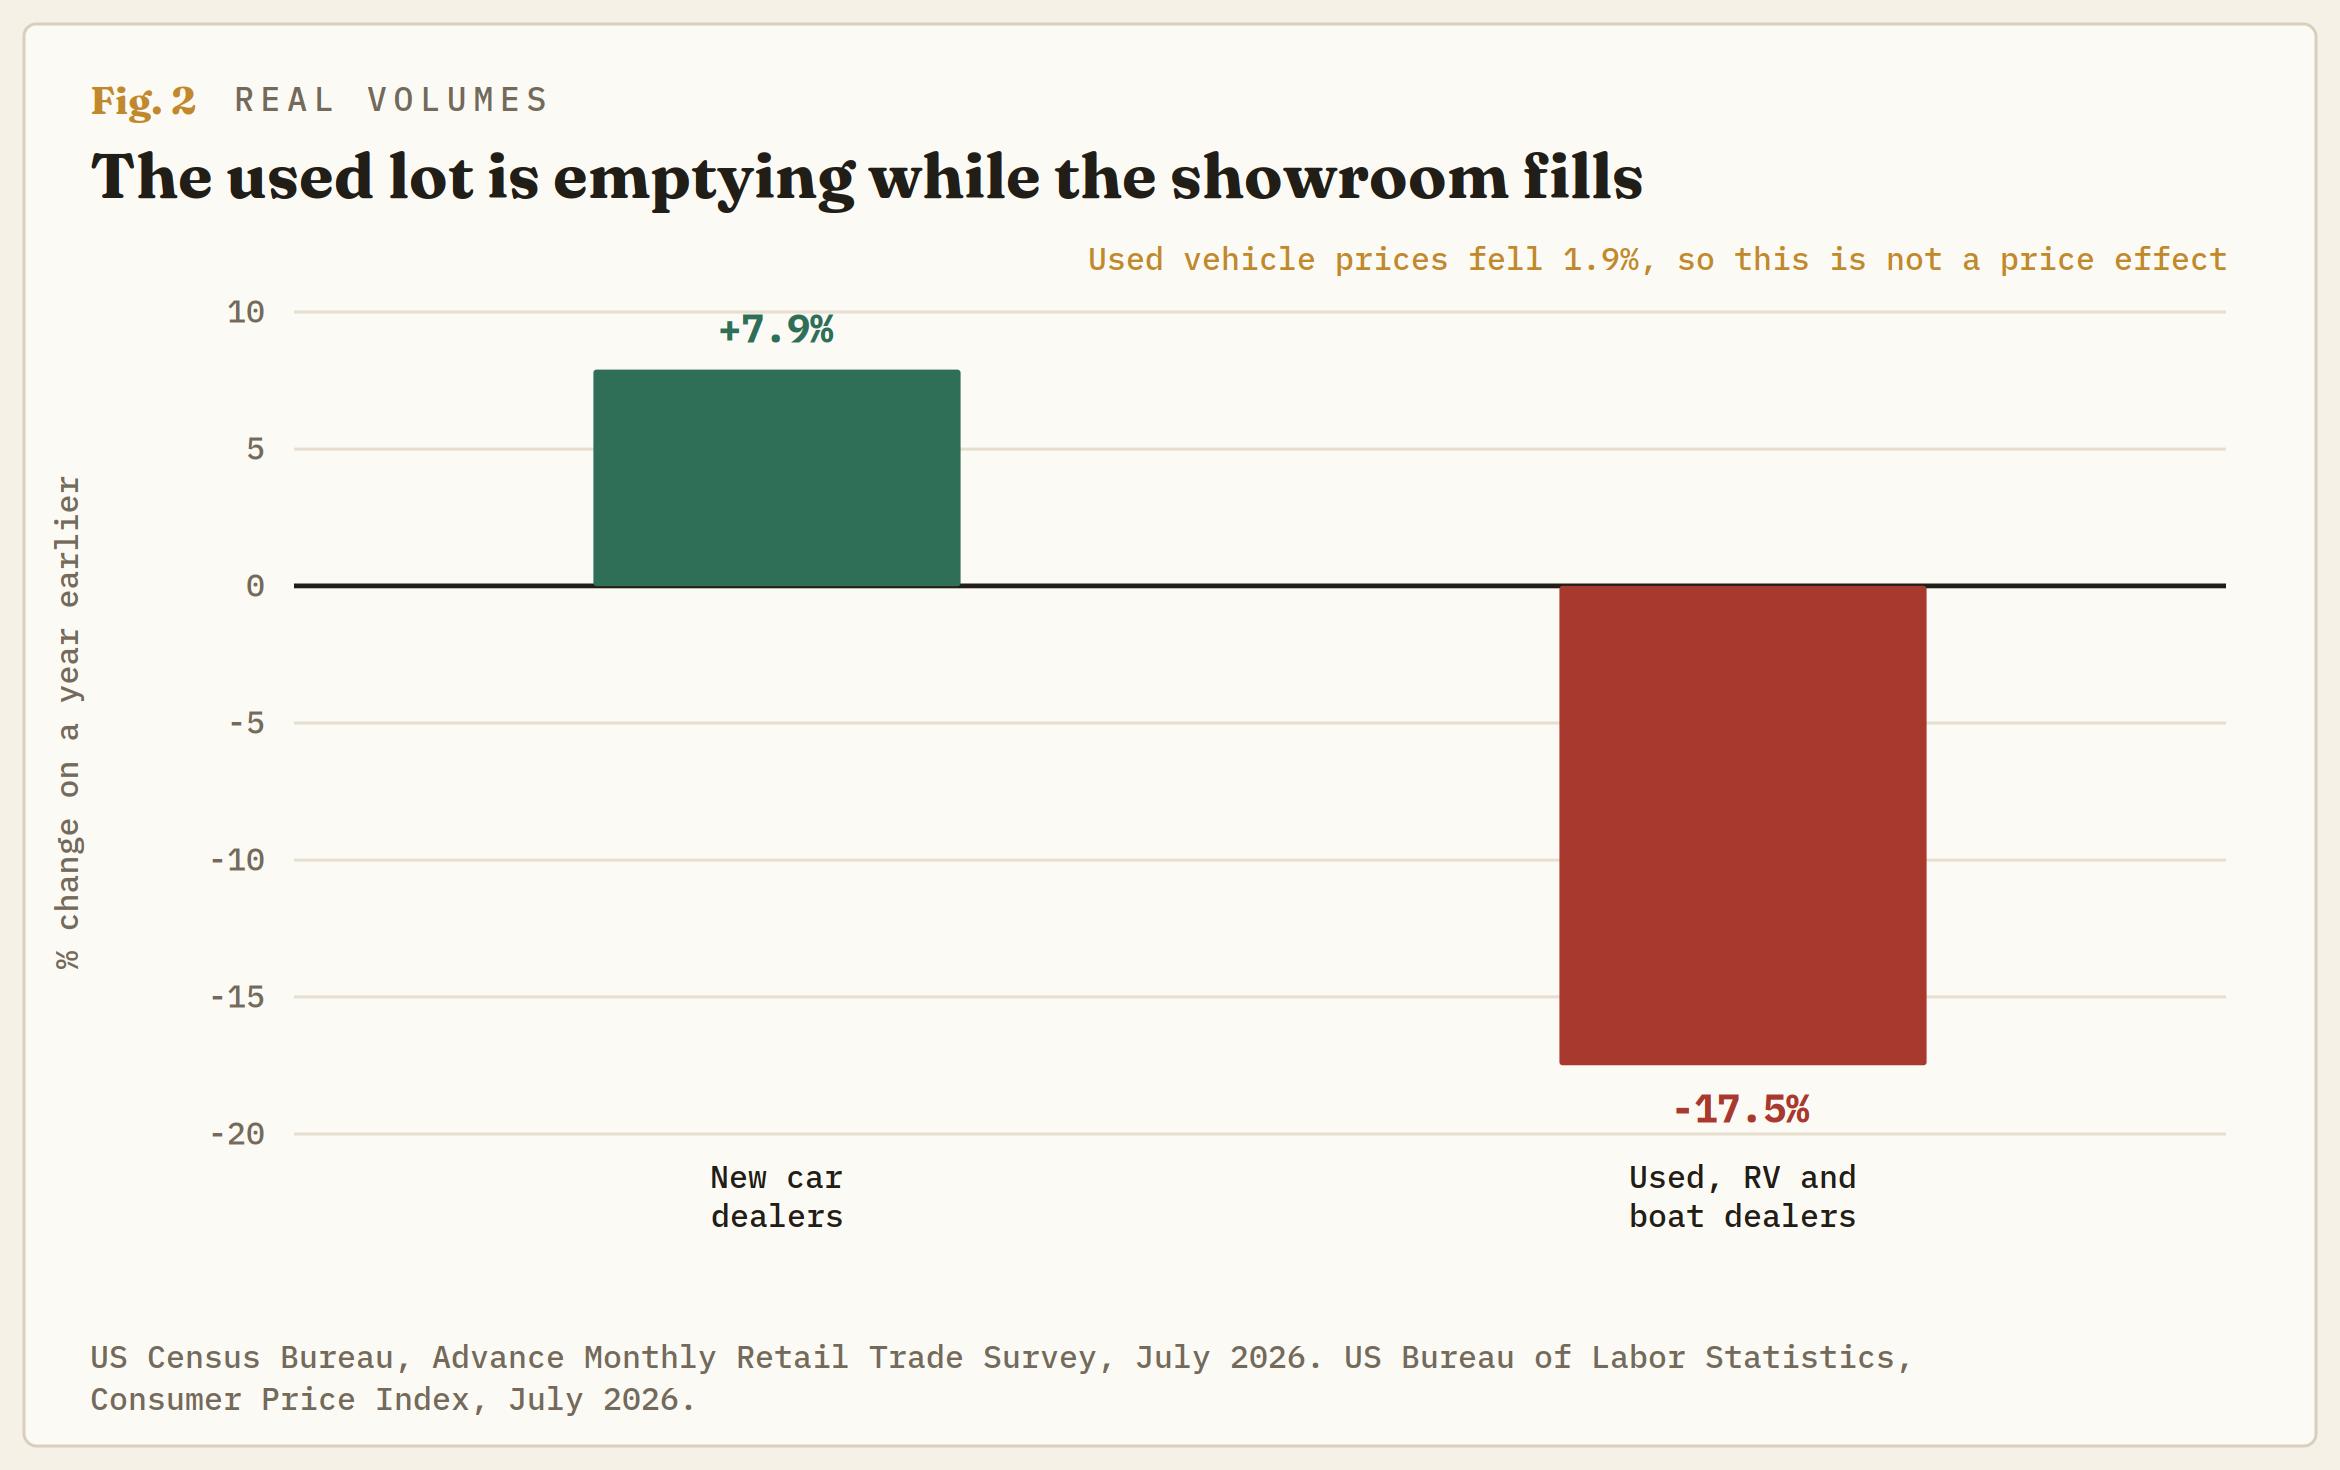
The auto line printed 1.9% on the year and looks dull. It is not. New car dealers are broken out separately and that line is 8.4% higher before seasonal adjustment. Subtract it from its parent and the remainder, used car lots plus recreational vehicle, boat and motorcycle dealers, is -19.1%, roughly $5.895 billion of annual run rate gone.
Deflate both and the gap widens rather than closing. New vehicle prices are up 0.5% on the year, so new car volumes are up close to 8%. Used vehicle prices are down 1.9%, so the residual’s volumes are down nearer 17.5%. That is a 25-point spread in real terms inside one industry, and it cannot be a price effect, because the prices moved the wrong way to produce it.
The corroboration sits one line below. Auto parts, accessories and tire stores are 8.2% higher on the year against the vehicle category’s 2.4%. Households are maintaining the fleet they already own rather than replacing it. With the policy rate at 3.50%-3.75% and the curve pricing hikes rather than cuts, financing a depreciating discretionary asset is the first thing to go, and a boat is the easiest purchase in America to postpone.
Two consumers, one dataset
Grocery store sales are 0.8% higher on the year against food at home inflation of 2.7%, so real grocery volumes are contracting close to 2%. Restaurant sales are 5% higher against 3.4% menu inflation, so real restaurant volumes are up 1.5%. People are eating out more in volume terms despite eating out having got relatively more expensive, not less.
Some of that grocery weakness is administered rather than behavioural, and this is where the report needs a source it does not contain. The Supplemental Nutrition Assistance Program (SNAP) has shed 5.35 million recipients over the year to April 2026, the most recent month published by the US Department of Agriculture (USDA), and monthly benefit dollars have fallen from $7.915 billion to $6.916 billion. That is a $999 million monthly withdrawal, near $12 billion annualised, from households with a marginal propensity to consume close to one. The benefits are restricted to grocery channels and cannot be spent in a restaurant.
Set that against food and beverage store sales of $85.526 billion a month and the withdrawal is worth 1.17 percentage points of the category, which is larger than the 0.9% the category actually grew. The series has now fallen for seven consecutive months and the annual decline is widening rather than stabilising. Most of the grocery contraction is a fiscal transfer being switched off, not a household cutting back.
The same split shows up where nothing is administered at all. Clothing store sales are 5% higher on the year, which sounds healthy until the category is opened: family clothing stores are 9.1% higher and women’s clothing stores are 6.2% lower. Deflate both by apparel prices and that is roughly 5% growth against 10% contraction in volume. Nobody buys fewer clothes because they feel richer.
Most of what gets written about this report is noise
The release publishes its own standard errors and almost nobody reads them. The headline -0.6% clears the 90% confidence bar. Ex-autos at -0.3% and ex-autos-and-gasoline at -0.2% both carry the asterisk marking an interval that includes zero, and so did June’s 0.2%. The only statistically real number in the monthly print is the one contaminated by fuel and vehicles.
Run each category against its own standard error and the same filter applies. Nonstore retail, general merchandise, motor vehicles, gasoline and clothing all moved by more than their measurement error. Furniture, electronics, building materials, sporting goods and food services did not. Half the category commentary this release generates will be describing sampling noise with a straight face.
One more line is worth having. The report publishes the average revision from advance to preliminary by category, and nonstore runs -0.2 points while gasoline runs -0.3. Both of July’s weakest lines revise down more often than up, so the September 16 release is likelier to deepen this print than to rescue it.
What the headline converges to
Gasoline receipts have two months of decline behind them, and the base they are measured against does not harden until the spring, so the pump keeps subtracting from the growth rate through the autumn. As it does, the headline falls toward the ex-gasoline line, which after inflation is under 1%.
Whether that reads as disinflation or as demand destruction depends on which numbers move next, and three observables answer it. Fuel volumes are the first: if gallons keep falling while prices fall too, the household is banking the dividend rather than spending it. The auto residual is the second, where used and recreational vehicle sales turning up would say the deferral was about rate expectations rather than income. Grocery volumes stripped of the benefit withdrawal are the third, and the cleanest test of whether the household underneath the transfer is genuinely shrinking.
The rate market has read soft consumer data as dovish all year. CME FedWatch on August 10 had September at a coin flip with a hike fully priced by December 9. That pricing survives a weak retail print that is weak because fuel got cheaper. It does not survive one that is weak because Americans stopped driving. This report contains both, and the next two prints decide which one it was.
