


Gold rallies further to near $4,135 in the Asian trade on Thursday, the highest level seen in almost two weeks. The precious metal continues to attract bids as the victory of United States (US) Democrats in both the House and the Senate has weighed heavily on US bond yields and the US Dollar (USD).
ING argued that Democrat clean sweep would likely “lead to gridlock on the debt ceiling, a prolonged government shutdown next year”. The bank further warned that “fears of tougher regulation could weigh on Artificial Intelligence (AI) stocks (we’ve recently seen how that can hit the greenback)”.
What is the current status of US yields and the US Dollar?
As of writing, 10-year US Treasury Yields are down 1% to near 4.84%. This is the lowest level seen in over six weeks. Theoretically, lower yields on US interest-bearing assets result in an improvement in the appeal of non-yielding assets, such as Gold.
Meanwhile, the US Dollar Index (DXY), which gauges the Greenback’s value against six major currencies, trades 0.22% lower to near 101.26. The DXY is close to its monthly low of 101.10 posted on Wednesday.
Technically, a lower US Dollar makes the Gold price a favorable risk-reward bet for investors.
US NFP – next key trigger
The next key trigger for global markets and the Gold price is the US Nonfarm Payrolls (NFP) data for October, which will be released on Friday. The NFP data is expected to have a significant impact on Federal Reserve’s (Fed) interest rate expectations.
Ahead of the US official employment report, ADP Employment Change data for October has set a negative tone. On Wednesday, the data showed that the private sector created 86K fresh jobs, higher than 69K estimates.
TD looks for subdued October jobs print but firmer three-month trend
According to TD Securities, the upcoming US October employment report is likely to remain soft, with the bank expecting nonfarm payrolls to come in at a “subdued” 40k, following job gains that “moderated to 29k in September.” Even so, TD stresses that, “despite the subdued, below-consensus print, our forecast would be within the range of breakeven job gains and result in an increase in the three-month moving average.”
Gold Technical Analysis
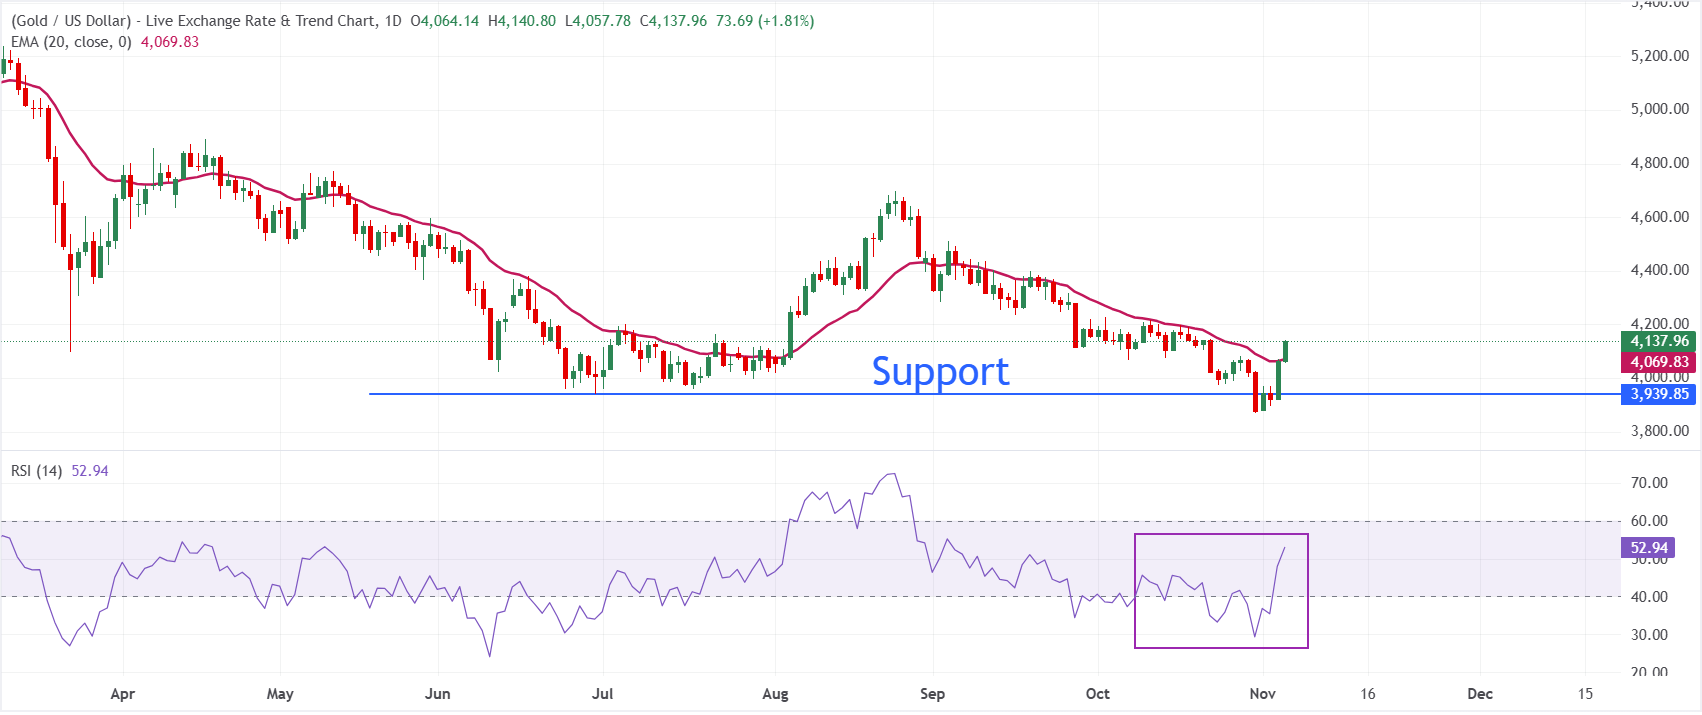
In the daily chart, XAU/USD trades at $4,138.12. The metal has pushed back above its 20-day Exponential Moving Average (EMA) at $4,069.85, tilting the near-term bias to the upside as price is now supported by this short-term trend gauge. Momentum has improved, with the Relative Strength Index (RSI) at 52.95 edging into positive territory, which suggests that buying pressure is re-emerging after the recent pullback, though not yet at an overextended stage.
On the downside, initial support is located at the 20-day EMA around $4,069.85, where a decisive break would undermine the nascent bullish tone and open the door for a deeper retracement. While no clear overhead technical barriers are defined by the available indicators, the bias remains constructive as long as XAU/USD holds above the 20-day EMA, with further gains likely to face supply at prior swing highs on the broader chart.
(The technical analysis of this story was written with the help of an AI tool. Know more.)
Gold FAQs
Gold has played a key role in human’s history as it has been widely used as a store of value and medium of exchange. Currently, apart from its shine and usage for jewelry, the precious metal is widely seen as a safe-haven asset, meaning that it is considered a good investment during turbulent times. Gold is also widely seen as a hedge against inflation and against depreciating currencies as it doesn’t rely on any specific issuer or government.
Central banks are the biggest Gold holders. In their aim to support their currencies in turbulent times, central banks tend to diversify their reserves and buy Gold to improve the perceived strength of the economy and the currency. High Gold reserves can be a source of trust for a country’s solvency. Central banks added 1,136 tonnes of Gold worth around $70 billion to their reserves in 2022, according to data from the World Gold Council. This is the highest yearly purchase since records began. Central banks from emerging economies such as China, India and Turkey are quickly increasing their Gold reserves.
Gold has an inverse correlation with the US Dollar and US Treasuries, which are both major reserve and safe-haven assets. When the Dollar depreciates, Gold tends to rise, enabling investors and central banks to diversify their assets in turbulent times. Gold is also inversely correlated with risk assets. A rally in the stock market tends to weaken Gold price, while sell-offs in riskier markets tend to favor the precious metal.
The price can move due to a wide range of factors. Geopolitical instability or fears of a deep recession can quickly make Gold price escalate due to its safe-haven status. As a yield-less asset, Gold tends to rise with lower interest rates, while higher cost of money usually weighs down on the yellow metal. Still, most moves depend on how the US Dollar (USD) behaves as the asset is priced in dollars (XAU/USD). A strong Dollar tends to keep the price of Gold controlled, whereas a weaker Dollar is likely to push Gold prices up.
