


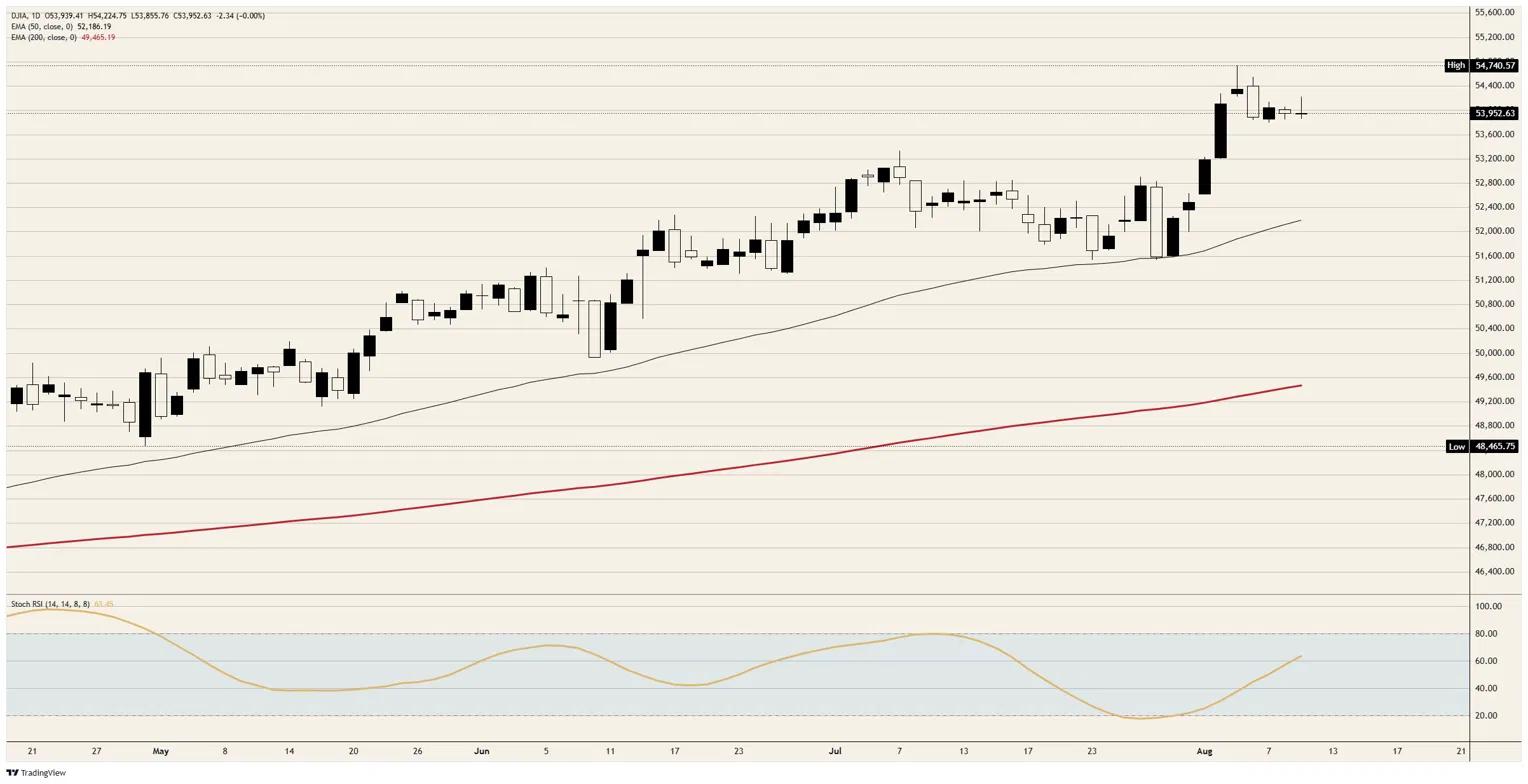
The Dow Jones Industrial Average broke the three-session coil that had pinned it beneath its record, traded up through 54,200, and has since surrendered the entire move. The index sits just beneath 54,000, flat against yesterday’s close, on a session range of close to 370 points that has delivered no net change at all. The 53,800 area has now been tested and held three days running.
The breakout ran into Tehran
Hopes that the Strait of Hormuz would reopen faltered through the session, and the equity market surrendered its gains alongside them. Iranian officials told wires on Tuesday that an agreement with Oman on new shipping routes would not by itself open the waterway, and that Hormuz stays shut for as long as Washington declines to change its behaviour. Crude Oil traded roughly 1% higher above $83.00, with the international grade above $88.00.
What moved was not the timing of a deal but what a deal is now understood to buy. The route negotiation with Oman, described by Qatar’s foreign ministry on the same day as advanced, fixes geography rather than access, and Tehran’s separate conditions for access run to the naval blockade, sanctions, the withdrawal of American forces, payment for war damage and the release of frozen assets.
Trump spent Monday demanding that Iran compensate victims’ families and the Gulf states it has struck, hours after Tehran demanded reparations from Washington as a condition of reopening. Two compensation claims pointed at each other describe a negotiation without a counterparty rather than one that slips a week.
The bond market took the barrel more seriously than the equity market did. The 10-year Treasury yield pushed back above 4.72% after trading near 4.61% on Friday morning, and September rate-increase pricing, a coin flip as recently as yesterday, has been marked higher again. That is the second consecutive session in which the rates market has repriced hard and the index has not moved at all.
Hiring plans against hiring
Small business optimism reached its best level in almost a year, and the component that carried it was the one the tape should trust least. The National Federation of Independent Business (NFIB) index rose 2.4 points in July to 99.8, above its 52-year average and the highest reading since August 2025, with hiring plans the largest single contributor. A net 20% of owners intend to create jobs over the next three months, the strongest since October 2022.
Every measure of hiring that counts rather than asks went the other way. The ADP four-week average printed 8.25K against 11K previously, roughly half the pace it ran in late July, and July payrolls contracted by 23K against an 80K consensus. Intent sits at a four-year high while execution is negative, a gap wide enough that one of the two series has to be wrong.
The reconciliation sits in the participation rate, which has fallen to 61.5% and is now at its lowest outside the pandemic shutdown since 1976. Owners report the highest share of unfillable openings since June 2025 because the workers have left the count, not because demand for them collapsed. June’s fall in unemployment to 4.2% came from roughly 720K people exiting the labour force rather than from anybody being hired.
A shrinking labour force lowers the payroll figure the economy needs to stand still, so a 23K contraction makes a weaker case for policy relief than it reads. This is the labour share of output at its lowest since 1947 viewed from the supply side, and it is why September stays live into Wednesday rather than being resolved by one bad Friday.
Three red bands before Friday
July Consumer Price Index (CPI) lands Wednesday at 12:30 GMT with consensus at 0.1% MoM against a 0.4% decline in June, and 3.4% YoY from 3.5%. Core is seen at 0.2% MoM from zero and 2.5% YoY from 2.6%. The monthly budget statement follows at 18:00 GMT, with a 346 billion Dollar deficit expected against 120 billion previously.
Producer Price Index (PPI) follows on Thursday at 12:30 GMT, 0.2% MoM against a 0.3% fall and 4.9% YoY from 5.5%, with the core measure at 0.3% MoM and 4.2% YoY from 4.7%. Initial claims are seen at 202K from 199K, and two regional Federal Reserve presidents speak either side of that release, the first of them a July dissenter for a quarter-point increase.
Retail sales arrive Friday at 0.1% MoM against a 0.2% prior, with Michigan sentiment expected at 54.5 from 55.2 and the one-year and five-year inflation expectations carrying priors of 4.2% and 3.3%. None of it answers the question the barrel is asking, because July prices were collected before Crude Oil ran back above $83.00, so the passthrough cannot show up until September.
Levels to watch
Resistance: The session high just above 54,200 is now a marked failure and the first line any recovery has to clear. Above it, 54,500 is the last shelf before the record just short of 54,750.
Support: The 53,800 area has held on three consecutive sessions and carries the whole structure. Beneath it, 53,500 is the first objective, with the 50-day Exponential Moving Average (EMA) near 52,200 a long way below.
Bias: Bullish while the 53,800 area holds, because a third successful defence of a floor outranks one rejected high, and the daily Stochastic Relative Strength Index (Stoch RSI) near 63 is still climbing. The failed break above 54,200 says the record does not come without a soft print, so Wednesday’s release is the trigger rather than the tape. A daily close beneath 53,800 invalidates and opens 53,500.
Dow Jones daily chart
Dow Jones FAQs
The Dow Jones Industrial Average, one of the oldest stock market indices in the world, is compiled of the 30 most traded stocks in the US. The index is price-weighted rather than weighted by capitalization. It is calculated by summing the prices of the constituent stocks and dividing them by a factor, currently 0.152. The index was founded by Charles Dow, who also founded the Wall Street Journal. In later years it has been criticized for not being broadly representative enough because it only tracks 30 conglomerates, unlike broader indices such as the S&P 500.
Many different factors drive the Dow Jones Industrial Average (DJIA). The aggregate performance of the component companies revealed in quarterly company earnings reports is the main one. US and global macroeconomic data also contributes as it impacts on investor sentiment. The level of interest rates, set by the Federal Reserve (Fed), also influences the DJIA as it affects the cost of credit, on which many corporations are heavily reliant. Therefore, inflation can be a major driver as well as other metrics which impact the Fed decisions.
Dow Theory is a method for identifying the primary trend of the stock market developed by Charles Dow. A key step is to compare the direction of the Dow Jones Industrial Average (DJIA) and the Dow Jones Transportation Average (DJTA) and only follow trends where both are moving in the same direction. Volume is a confirmatory criteria. The theory uses elements of peak and trough analysis. Dow’s theory posits three trend phases: accumulation, when smart money starts buying or selling; public participation, when the wider public joins in; and distribution, when the smart money exits.
There are a number of ways to trade the DJIA. One is to use ETFs which allow investors to trade the DJIA as a single security, rather than having to buy shares in all 30 constituent companies. A leading example is the SPDR Dow Jones Industrial Average ETF (DIA). DJIA futures contracts enable traders to speculate on the future value of the index and Options provide the right, but not the obligation, to buy or sell the index at a predetermined price in the future. Mutual funds enable investors to buy a share of a diversified portfolio of DJIA stocks thus providing exposure to the overall index.
