
Close Menu
USD TO CAD
    What's Hot

    Canadian dollar weakens as oil prices drop on US-Iran diplomacy hopes

    23 September 2026

    JPMorgan resumes Wave Life Sciences stock rating at Neutral

    23 September 2026

    Price slide extends on pipeline restart – Danske Bank

    23 September 2026
    Facebook X (Twitter) Instagram
    Trending
    • Canadian dollar weakens as oil prices drop on US-Iran diplomacy hopes
    • JPMorgan resumes Wave Life Sciences stock rating at Neutral
    • Price slide extends on pipeline restart – Danske Bank
    • Testing support near 1.3300 against US Dollar – UOB
    • Canadian dollar edges higher as oil retreat eases inflation concerns
    • Why markets are watching this summit so closely
    • Why Ontario is seeing more consumer insolvencies than the rest of Canada
    • Form 4 Ciena Corp For: 22 September
    USD TO CADUSD TO CAD
    Wednesday, September 23
    • Home
    • USD TO CAD
    • Market News
    • USD/CAD Commentary
    • Canadian Dollar
    • Canadian Economy
    • Exchange Rates
    • Finance Canada
    • Money Guides
    USD TO CAD
    Home»USD TO CAD»Buyers struggle to clear the 21-day SMA
    USD TO CAD

    Buyers struggle to clear the 21-day SMA

    Robert JessiBy Robert Jessi11 August 2026No Comments2 Mins Read
    Facebook Twitter LinkedIn Telegram Pinterest Tumblr Reddit WhatsApp Email
    Share
    Facebook Twitter LinkedIn Pinterest Email

    USD/CHF trades with a positive bias on Tuesday as the US Dollar (USD) consolidates its recent gains ahead of Wednesday’s US Consumer Price Index (CPI) data. Price action has stabilized above the 50-day Simple Moving Average (SMA) following a sharp pullback from above 0.8200 in late July.

    At the time of writing, the pair trades around 0.8113, extending gains for a second consecutive day. Meanwhile, the US Dollar Index (DXY), which tracks the Greenback’s value against a basket of six major currencies, hovers around 99.80, holding above the 100-day SMA at 99.75.
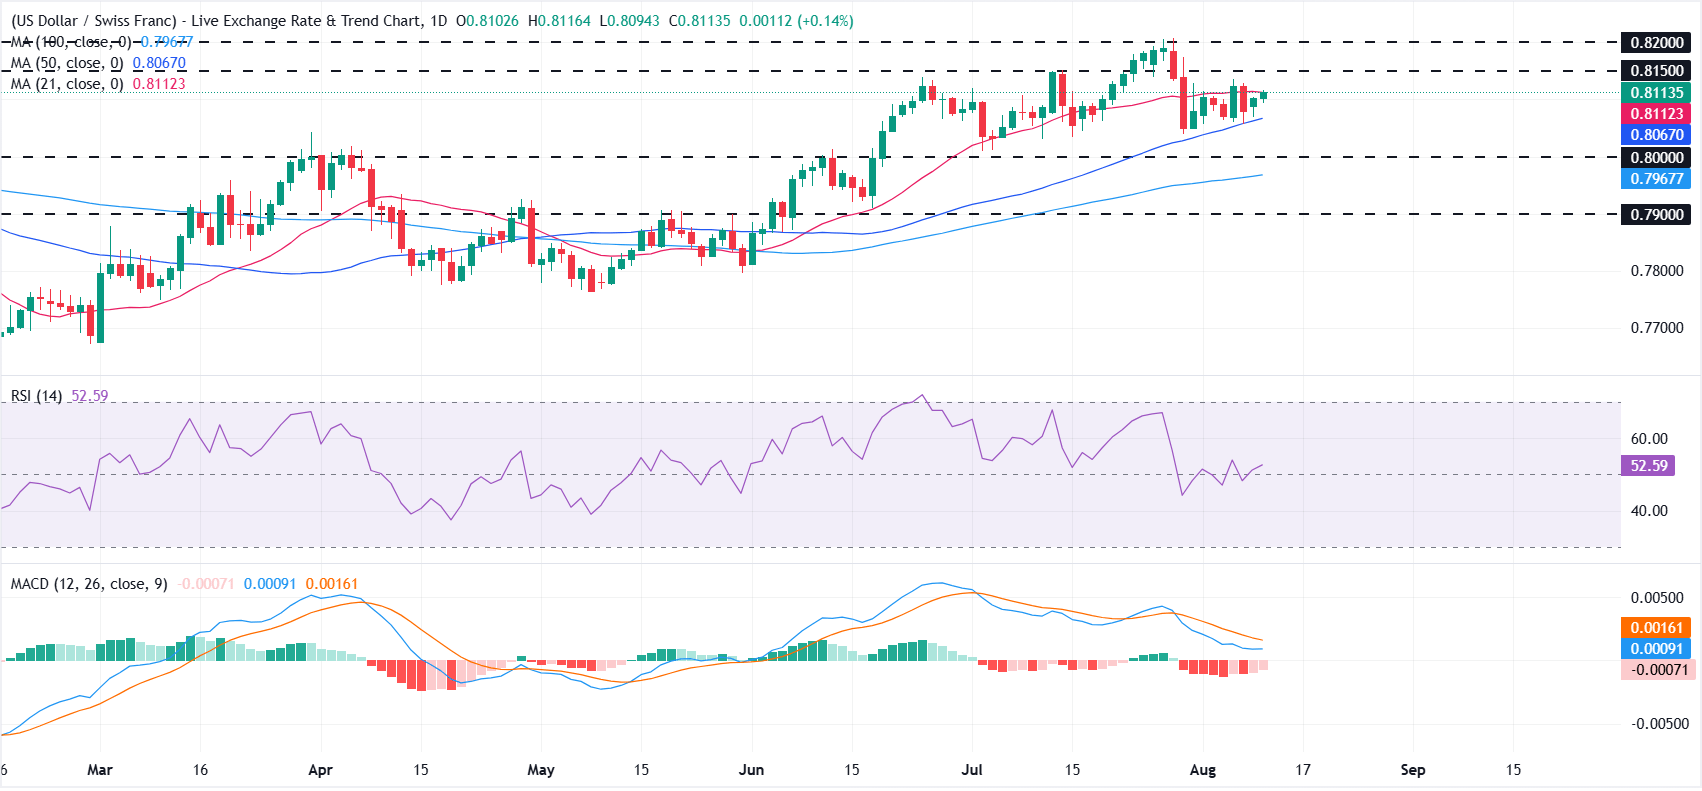
    USD/CHF holds a mildly positive technical tone above the 50-day SMA at 0.8067, though the 21-day SMA at 0.8112 keeps gains in check.

    The 100-day SMA at 0.7968 supports the broader recovery structure, while the Relative Strength Index (RSI) near 52 points to balanced momentum after cooling from earlier overbought levels.

    The Moving Average Convergence Divergence (MACD) remains in negative territory, suggesting that upside momentum has weakened. However, the broader tone stays constructive as long as the pair holds above the 50-day SMA.

    A sustained break above the 21-day SMA could open the door to 0.8150, followed by the 0.8200 psychological mark. On the downside, a move below the 50-day SMA would expose the 0.8000 psychological level. Further losses could bring the 100-day SMA at 0.7968 and the horizontal support at 0.7900 into focus.

    (The technical analysis of this story was written with the help of an AI tool. Know more.)

    Economic Indicator

    Consumer Price Index (MoM)

    Inflationary or deflationary tendencies are measured by periodically summing the prices of a basket of representative goods and services and presenting the data as The Consumer Price Index (CPI). CPI data is compiled on a monthly basis and released by the US Department of Labor Statistics. The MoM figure compares the prices of goods in the reference month to the previous month.The CPI is a key indicator to measure inflation and changes in purchasing trends. Generally, a high reading is seen as bullish for the US Dollar (USD), while a low reading is seen as bearish.


    Read more.

    21day Buyers clear SMA struggle
    Share. Facebook Twitter Pinterest LinkedIn Tumblr Telegram Email
    Previous ArticleIran took back the Dow Jones Industrial Average breakout
    Next Article Canada’s monetary policy paused, inflation contained
    Unknown's avatar
    Robert Jessi
    • Website

    Cheif finance content and platform manager.

    Related Posts

    Price slide extends on pipeline restart – Danske Bank

    23 September 2026

    FX Outlook: Hawkish Fedspeak Breaks Oil-USD Link

    22 September 2026

    United States Dollar Index gathers strength to near 100.50 on hawkish Fed signals

    22 September 2026
    Add A Comment

    Comments are closed.

    Recent Posts
    • Canadian dollar weakens as oil prices drop on US-Iran diplomacy hopes
    • JPMorgan resumes Wave Life Sciences stock rating at Neutral
    • Price slide extends on pipeline restart – Danske Bank
    • Testing support near 1.3300 against US Dollar – UOB
    • Canadian dollar edges higher as oil retreat eases inflation concerns

    USDTOCAD

    Your trusted source for USD to CAD exchange rates, currency conversion, Canadian dollar updates, market news, and helpful finance guides.

    Live Rates Currency News Finance Guides

    Quick Links

    • About Us
    • Contact Us
    • Privacy Policy
    • Terms & Conditions

    Categories

    • USD TO CAD
    • Market News
    • USD/CAD Commentary
    • Canadian Dollar

    Finance Topics

    • Canadian Economy
    • Exchange Rates
    • Finance Canada
    • Money Guides

    © 2026 USD TO CAD. All rights reserved.

    Exchange rates are for informational purposes only and may not reflect bank rates.

    Your source for the serious news. This demo is crafted specifically to exhibit the use of the theme as a news site. Visit our main page for more demos.

    We're social. Connect with us:

    Facebook X (Twitter) Instagram Pinterest YouTube
    Top Insights
    Get Informed

    Subscribe to Updates

    Get the latest creative news from FooBar about art, design and business.

    © 2026 ThemeSphere. Designed by ThemeSphere.
    • Home
    • Buy Now

    Type above and press Enter to search. Press Esc to cancel.