


Here’s what the BTC price movement has looked like since the October 2025 high.
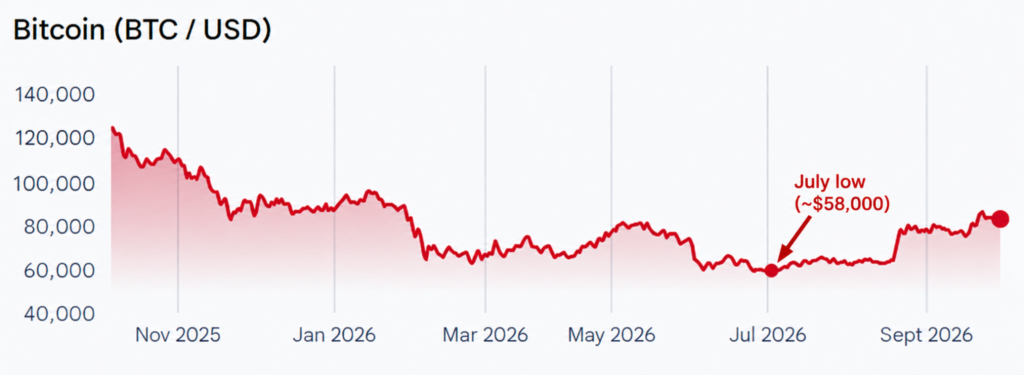
Source: Google Finance BTC-USD price chart as of Sept. 30, 2026.
Are BTC investors making any money?
Has the roughly 42% price jump in BTC made investors any money on their investments? The answer of course depends on when you made your investment in the cryptocurrency. Here’s what the to-date return on BTC looks like from the perspective of various historical time periods:
Source: Yahoo Finance BTC-USD price data as of Sept. 30, 2026.
As the table above shows, whether you’re making any gains as a BTC investor depends heavily on when you made your initial investment. An investor who entered the market one year ago is unfortunately still underwater (despite the steep rise in BTC over the past three months). However, an investor who entered the market two to five years ago would have done exceedingly well—with annualized returns ranging from 13.6% to 45.4% for those time periods.
This goes to show that while investors often get swept up in the daily or weekly swings of the crypto market, substantial gains have been made by buying and holding over several years instead of trying to time the lows and highs.
Bitcoin price is up, but what about other cryptocurrencies?
BTC usually leads crypto market movements, so is the roughly 42% increase over the past three months unique to BTC or have other large crypto coins posted bumper gains as well? The table below shows the numbers:
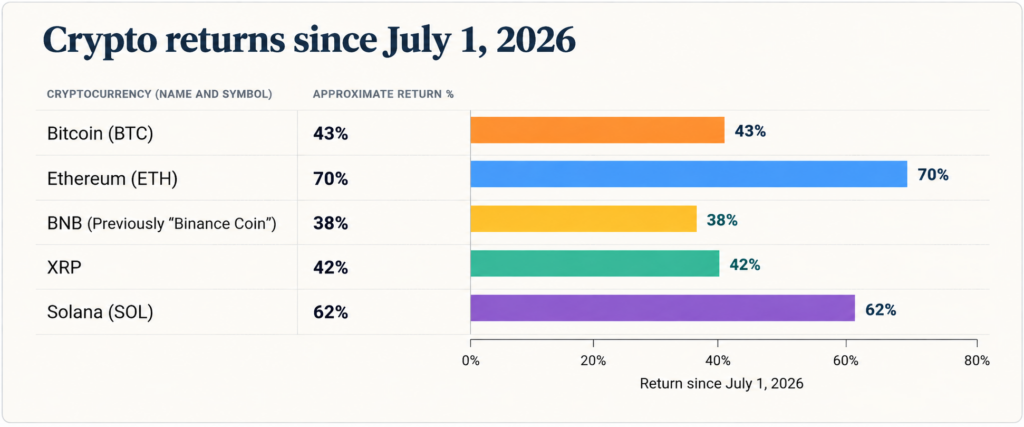
Source: Graphic created using ChatGPT, with data from Yahoo Finance as of Sept. 30, 2026.
As the table above shows, all the other large cryptocurrencies have also seen massive gains from Jul. 1, 2026—with ETH leading the charge, up about 70%. However, ETH’s short term outperformance could be wildly misleading if not interpreted in historical context.
Seen from a historical perspective, ETH has drastically underperformed BTC, as the 5-year historical price chart below shows. As the orange line in the chart (ETH) shows, if you’d have bought ETH five years ago, you’d be in the red.
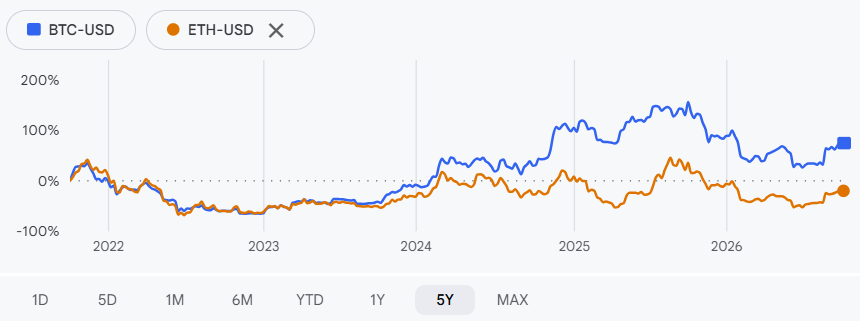
Source: Google Finance BTC and ETH 5-year price comparison chart as of Sept. 30th, 2026.
ETH’s underperformance compared to BTC
ETH’s underperformance compared to BTC is so wide that the way you feel about the crypto market right now could heavily depend on whether your five year old crypto portfolio is heavier on BTC or ETH. If you held only BTC over the past five years, you’d be up over 80%, but if you held only ETH during the past five years you’d be down over 10%.
To make the contrast between BTC and ETH clearer, the table below provides the absolute and annualized return percentages for both cryptocurrencies over various historical periods.
Stocks and BTC in one ETF—here’s how
In previous editions of this column and in previous MoneySense articles, I’ve written about the various crypto exchange traded funds (ETFs) available to Canadian investors; including pure play ETFs and diversified, multi-asset ETFs that include an allocation to crypto.
The latest offering in the crypto ETF space is iShares’ Equity + Bitcoin ETF Portfolio (IBQT). Launched on Aug. 5, 2026 and trading on the Toronto Stock Exchange (TSX), IBQT provides Canadian investors with exposure to Canadian equity, U.S. equity and other global equity markets with a small allocation to BTC. IBQT invests in other iShares ETFs—including IBIT (its spot BTC ETF). Given below is the IBQT’s holdings as of Sept. 29, 2026.
Source: Data from Blackrock’s IBQT website as of Sept. 30, 2026.
