


The Japanese Yen staged a spectacular 900-pip comeback after a historic US-Japan intervention. Less than three weeks later, that rescue is already showing signs of fading. The Yen is benefiting somewhat from a softer US Dollar, but its downward trend is likely to resume as the underlying pressure on the currency has not disappeared.
A historic, coordinated US-Japan currency intervention on July 30-31 led to a massive rally in the Japanese Yen (JPY), from a 40-year low near 164.00 to around 155.00 against the US Dollar. This was the first joint action between the two countries since 1998, specifically dedicated to buying and strengthening the Yen.
However, the operation, estimated to be worth up to $85 billion or the largest two-day intervention on record outside of October 2011, is proving no more durable than previous interventions as structural forces like massive public debt and the wide interest rate gaps have since caused the Yen to give up a significant portion of its recovery gains.
USD/JPY daily chart
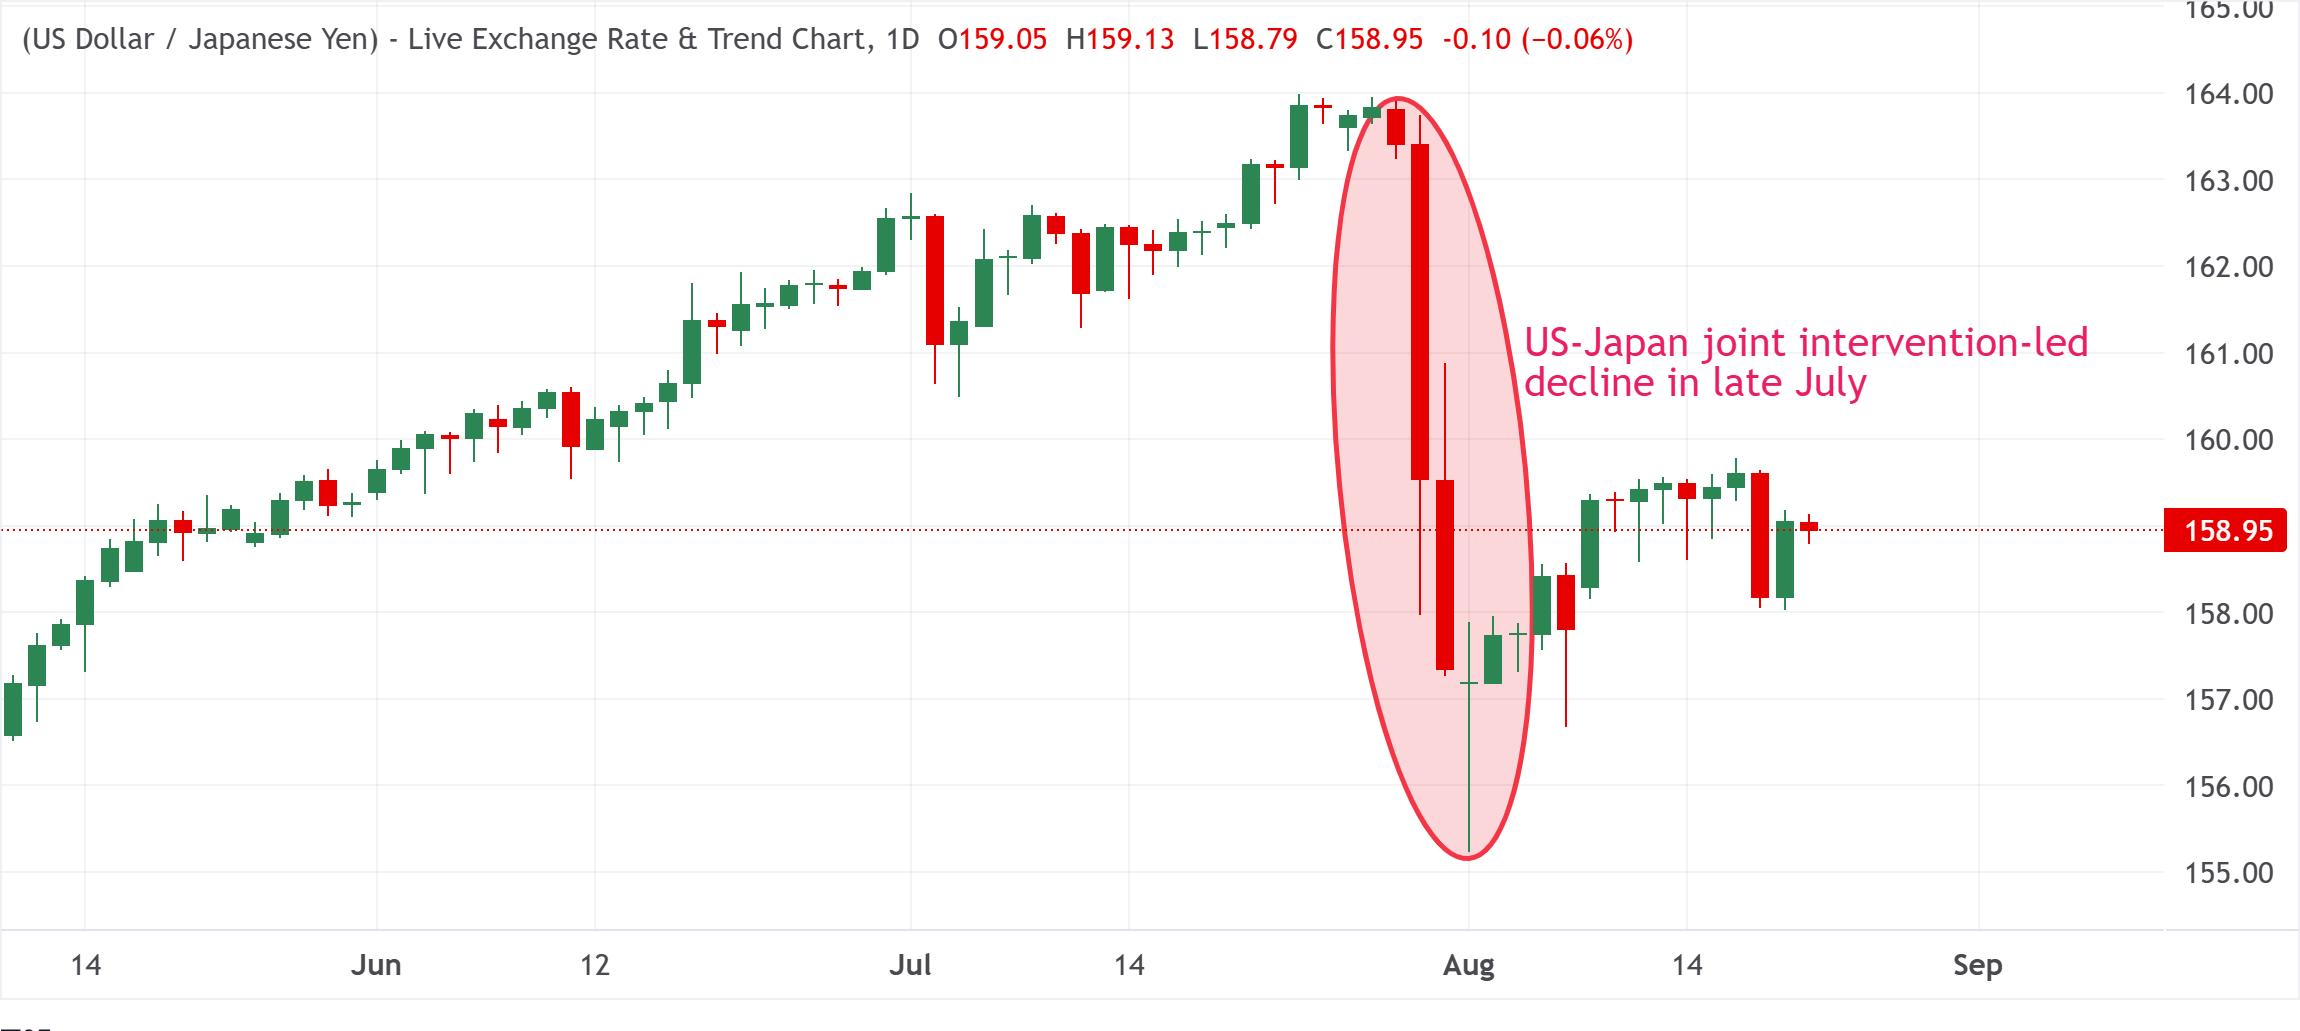
While a more hawkish Bank of Japan could defend the Yen, Japan’s fundamentals might continue to weigh on the battered currency and keep a check on hopes for a sustained strength in the near term.
Japan’s massive government debt remains a key concern
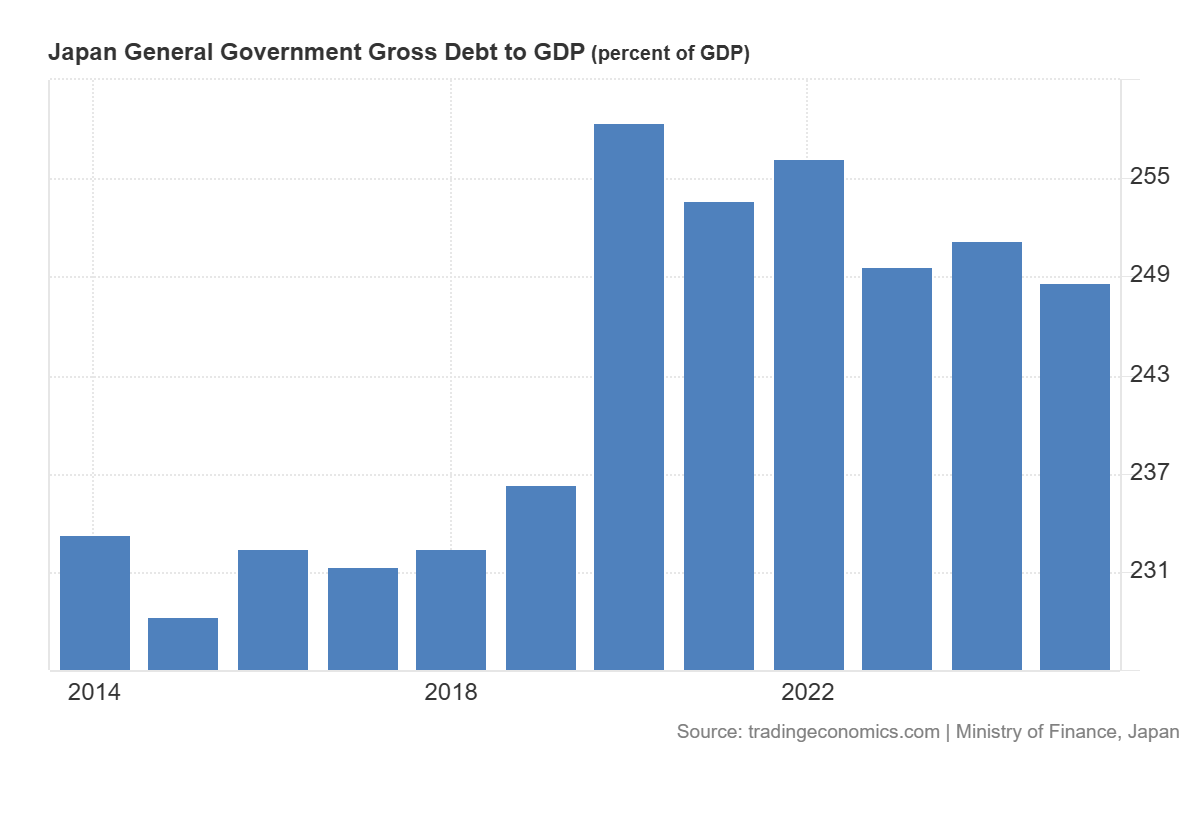
Japan’s fiscal position remains fragile. Its debt-to-GDP ratio exceeds 200%, which is the highest among major advanced economies.
Recent proposals under Prime Minister Sanae Takaichi to cut the consumption tax on food from 8% to 1% for two years starting in April 2027, paired with targeted cash benefits, will add tens of billions of dollars to the deficit. Without a finalized funding source, the package has heightened concerns about intensifying fiscal strains and the sustainability of Japan’s massive public debt
BoJ faces severe constraints in normalizing monetary policy
Expectations of aggressive interest rate hikes by the Bank of Japan have raised skepticism about whether Japan can service its liabilities without destabilizing global fixed-income markets.
Escalating global inflation fears from Middle East conflicts lifted the benchmark 10-year Japanese Government Bond (JGB) yield to levels not seen since September 1996. This threatens to push debt-servicing costs past the government’s budget baseline, which could severely constrain the BoJ’s capacity to tighten monetary policy.
Yen carry-trade likely to remain in play
The duration and ultimate ceiling of the BoJ’s rate-hike cycle matter far more than the pace. Analysts see the terminal rate peaking between 1.50% and 2.00% by mid-2027.
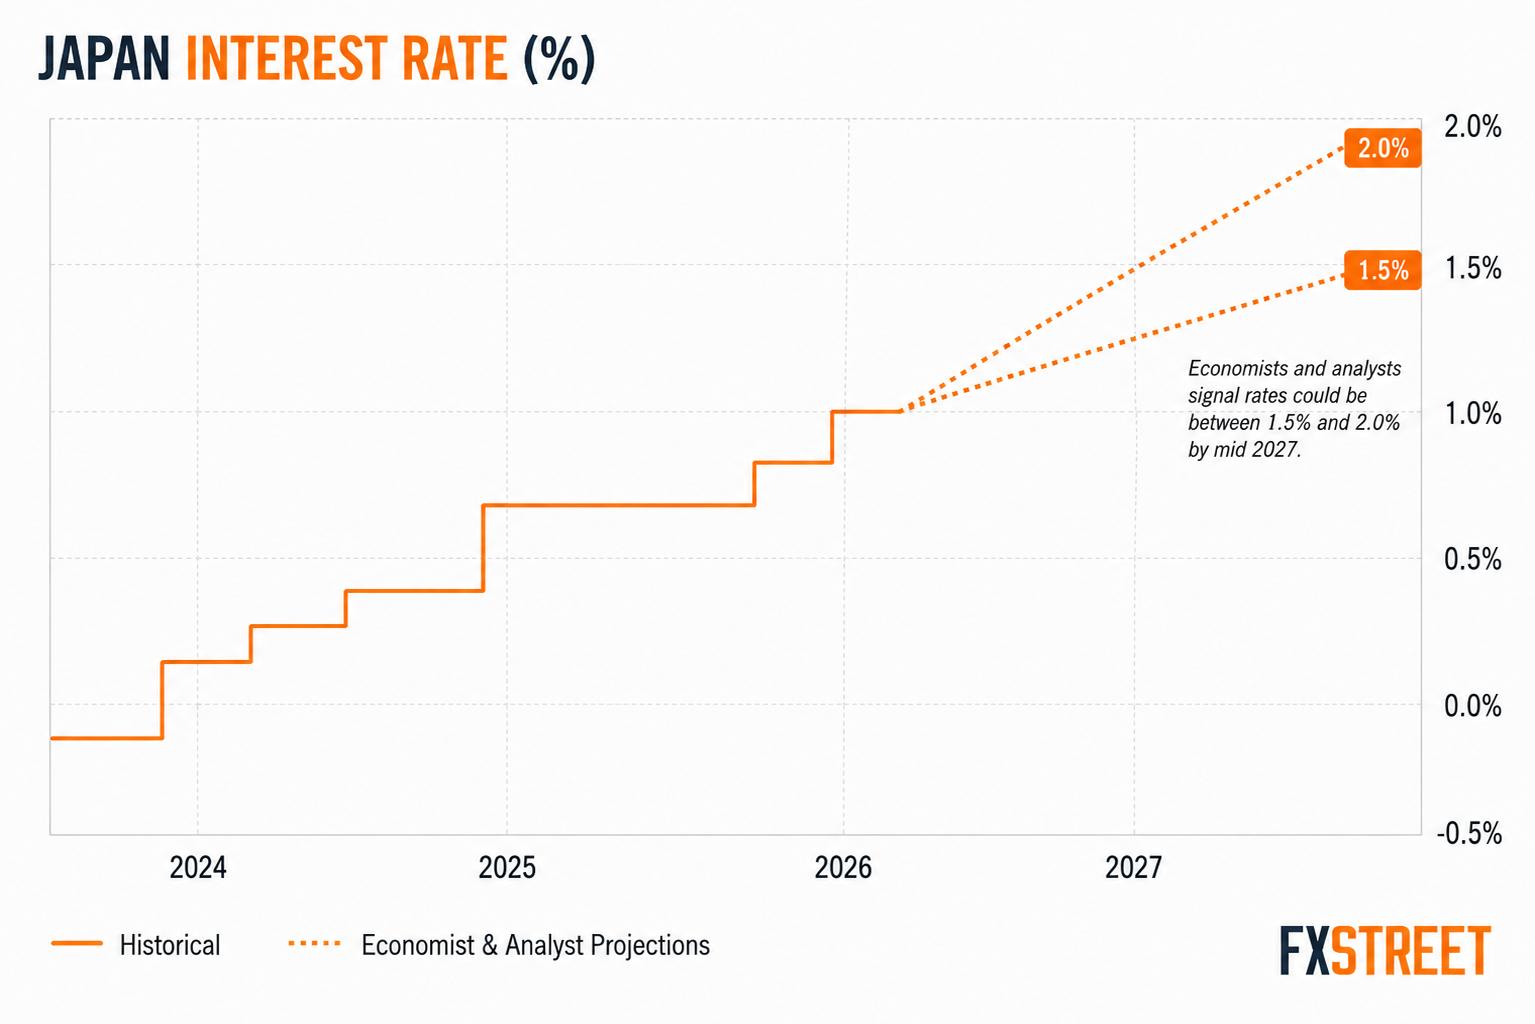
Even if this scenario becomes real, the policy rate in Japan would still be exceptionally low by global standards. The US Federal Reserve is expected to keep rates elevated for longer amid concerns about energy-driven inflation. This would incentivize investors to continue borrowing cheaply in Yen to fund investments in higher-yielding foreign assets, keeping the classic carry trade active.
JPY bearish potential seems intact
Unless the BoJ takes a very bold step to raise interest rates more aggressively, any attempted JPY recovery is likely to fade rather quickly. However, the BoJ faces a difficult policy trade-off amid constraints imposed by public finances and could maintain a cautious stance regarding future rate hikes. This suggests that the path of least resistance for the JPY remains to the downside.
All in all, the July intervention proved that Japan and the United States can still trigger a powerful short-term move in the Yen. But this doesn’t mean the currency’s underlying downside trend can be reversed that easily. The move could well prove futile, and we’ll likely see it in the next few weeks.
Japanese Yen technical outlook
The intervention-led decline confirmed a breakdown below the lower boundary of a well-established ascending channel, which extends from the April 2025 low. Moreover, the recent recovery over the past two weeks or so faltered near the said support breakpoint. This suggests that the broader trend for the USD/JPY pair remains bearish despite the latest bounce.
USD/JPY weekly chart
The Moving Average Convergence Divergence (MACD) indicator holds in negative territory with the line below its signal and a weakly negative histogram, while the Relative Strength Index (RSI) near 50 hints at fading bullish momentum rather than outright oversold conditions.
Any attempted recovery is more likely to confront immediate resistance at the former channel floor around 160.00, which now acts as the first cap. On the downside, the early August low around 155.25 could offer support to the USD/JPY pair. A convincing break below would pave the way for an extension of the recent corrective decline from a four-decade high.
